
In this meeting note, Surya and Jason reflect on their participation in a special course on “Assessment and Evaluation of Food System Sustainability.”
CONTEXT
Sustainable Food Systems (SFS) aims to support livelihoods and future generations by ensuring nutrition, health, environmental protection, resilience to shocks, and equity among all members in the food system. However, climate change, conflicts between countries, natural disasters, and trade disruptions are significant challenges that disrupt the functions of the food system. These disruptions highlight the need for a more robust SFS. Additionally, most of the Sustainable Development Goals (SDGs) are closely connected to the SFS.
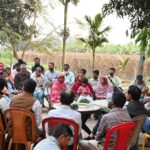
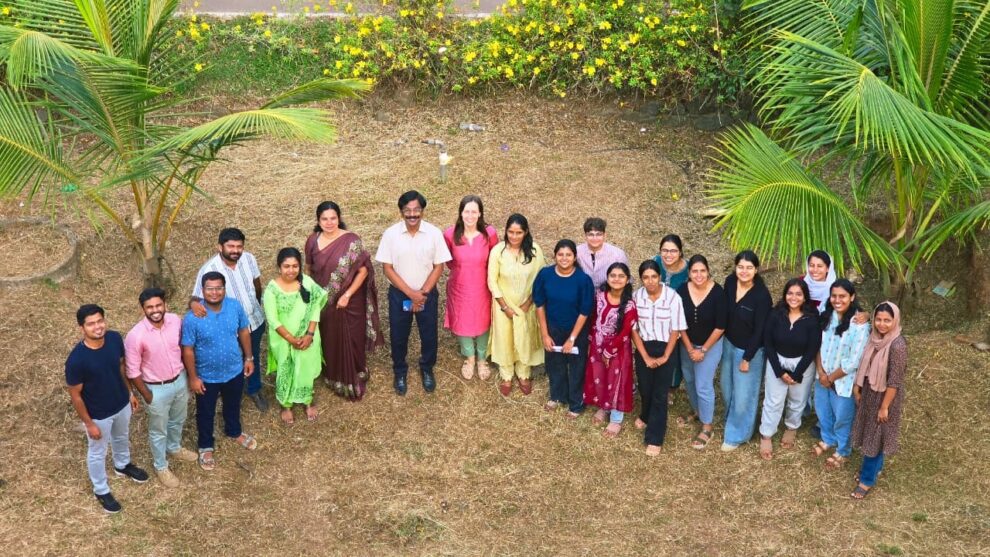
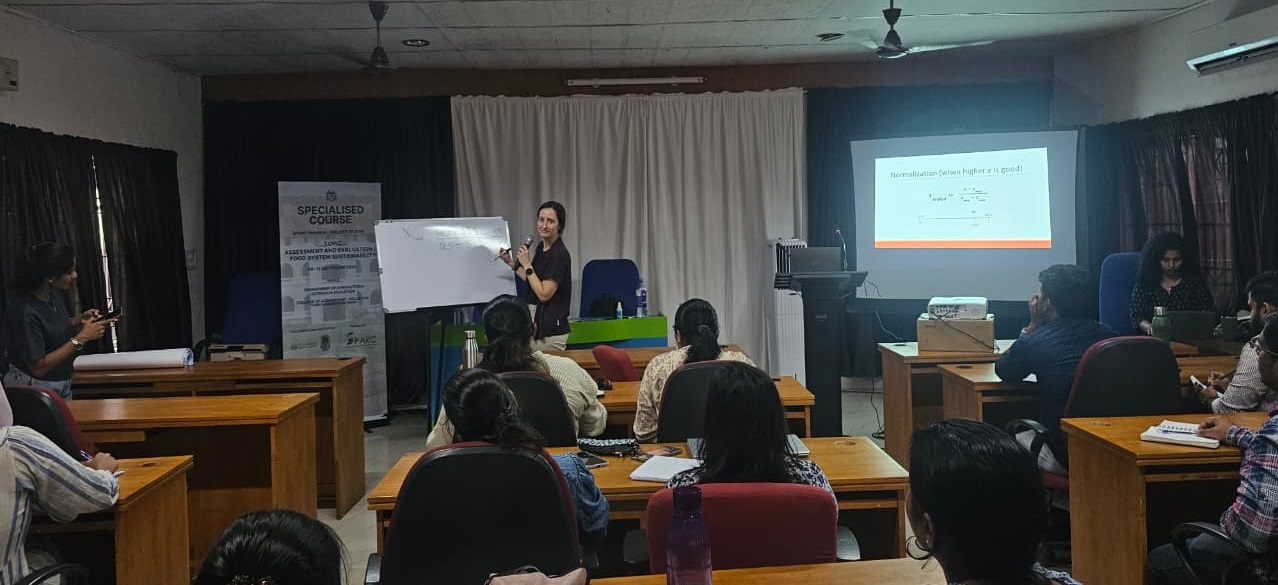
In light of this background, the Department of Agricultural Extension Education, College of Agriculture, Vellayani, and the University of Hohenheim, Germany, jointly organised a special course on “Assessment and Evaluation of Food System Sustainability” from September 8-12, 2025, at the College of Agriculture, Vellayani. This course was funded by the Scheme for Promotion of Academic and Research Collaboration (SPARC) Phase III, Ministry of Education, Government of India. The course attracted 18 participants, comprising Bachelor’s, Master’s, and Doctoral scholars in agricultural studies. It concentrated on understanding the diversity of sustainability and on quantifying and comparing its various aspects. Additionally, it emphasised having respondents develop their own research proposals. Here, we share our reflections and lessons learned from this special course.
Visioning
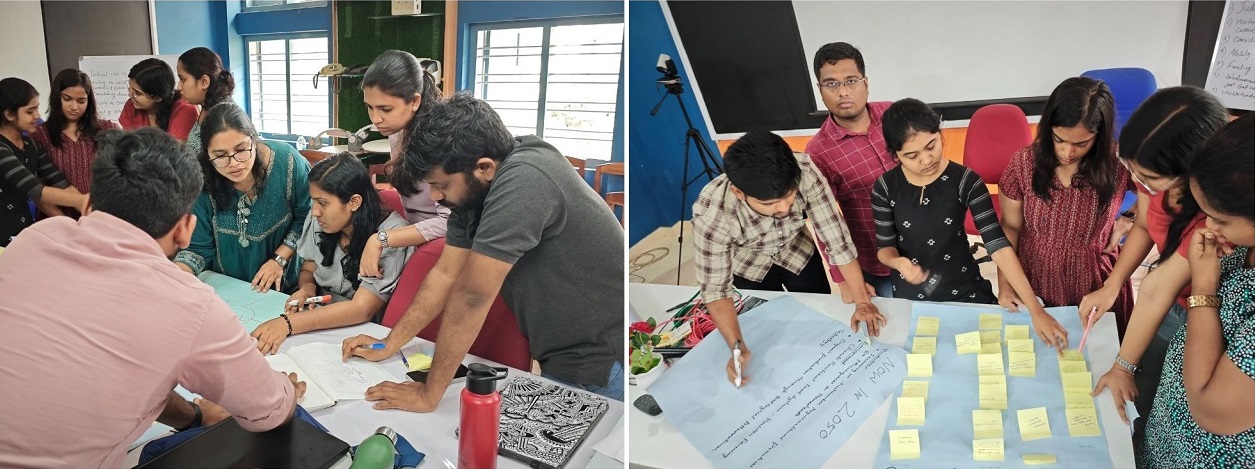
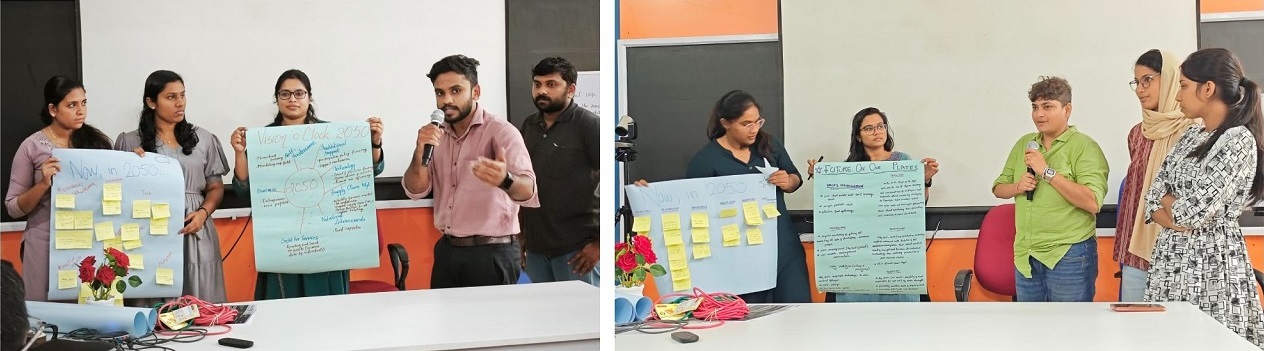
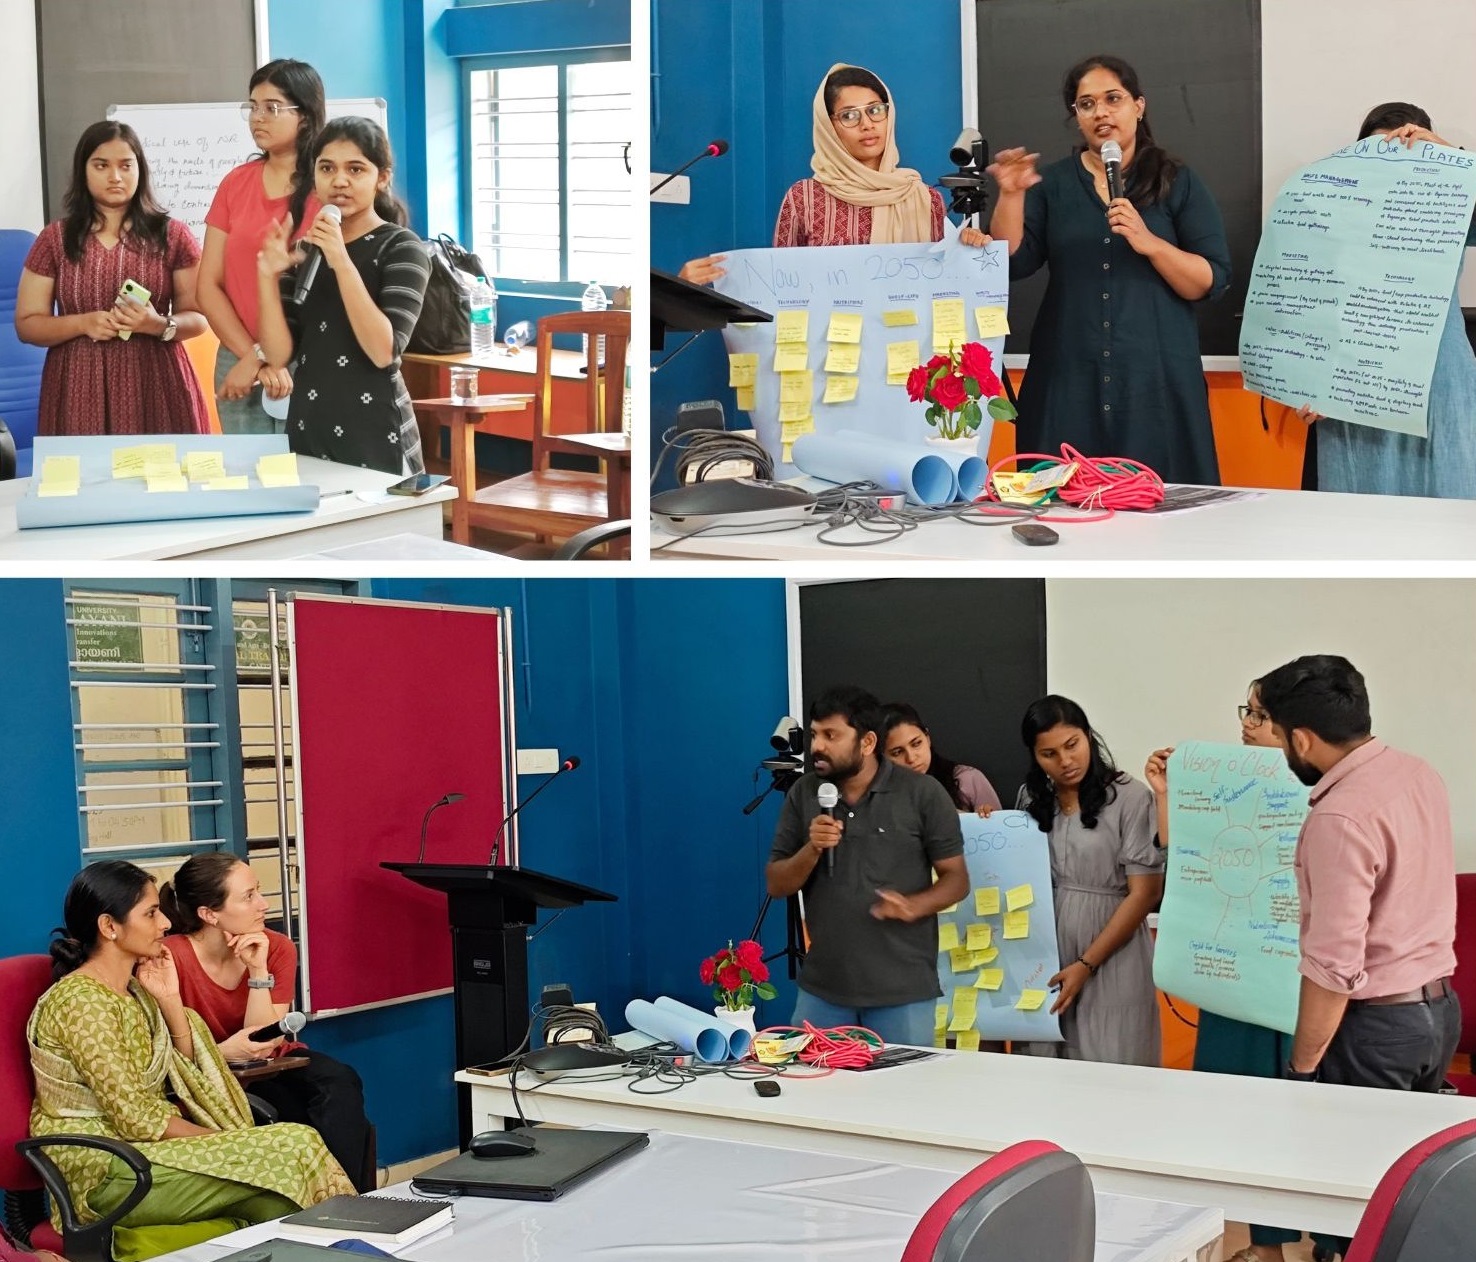
Visioning is a tool that brings actors together to develop a shared vision of the future. In simple terms, visioning is a participatory exercise in which participants are encouraged to envision, record, and present a future scenario under specified conditions. In this exercise, we, the course participants, envisioned the possible actions needed for SFS in 2050 and presented them collaboratively. This activity helped us identify key actions across different dimensions of food sustainability, including economic, social, and environmental aspects. The recorded actions include urban farming, evaluation and monitoring of schemes and policies, and enhancing extension outreach.
In addition, visioning serves as a bottom-up approach, nurturing group cohesion and a shared vision among stakeholders, as it involves their participation and perspectives. In general, visioning provides a sense of control and motivation, offering a possibility for fundamental change.
Actor mapping
Actor mapping helps identify the actors, their roles, and their influence within a system. For instance, the food system involves numerous actors, including farmers, consumers, input dealers, and the government. Some important methods for identifying food system actors include snowballing, surveys, participatory methods, and secondary data sources. Understanding the roles of actors and their level of influence is crucial for assessing the sustainability of the food system.
Actor mapping can be done based on actors’ type (e.g., Farmers), their role (e.g., Producer), level of influence (Low/Medium/High), the systems’ impact on them (Low/Medium/High), as well as their potential role in the study (e.g., inform) and inclusion notes (e.g., Women farmers). It provides a comprehensive understanding of the food system, which in turn aids in better decision-making, collaborations and further actions. For research purposes, it includes information on which actor to investigate and helps to visualise the variables and indicators for the study.
Sustainability Indicators
Indicators play a key role in measuring sustainability. They need to be specific, measurable and observable. They facilitate communication and progress, enable comparisons of progress/places, track changes over time, and help understand the impacts of any events and policies. Indicators may measure the concept/construct in a binary manner (yes/no) or in an absolute or relative amount. Therefore, they can measure the concept/construct either quantitatively or qualitatively. The scale of the indicator may be global (e.g., global annual methane emission), national (e.g., per cent of GDP from agriculture), subnational (e.g., rice yield in Tamil Nadu), grid cell (e.g., groundwater level in a particular watershed), and individual (e.g., farmer income). Indicators can be selected through various methods, including visioning, primary engagement with actors via participatory methods, literature review, and expert decision-making.
In particular, the visioning exercise enabled us to visualise the possible indicators, along with the necessary actions, for SFS in 2050 across three dimensions: economic, social, and environmental. The envisioned indicators include the adoption of innovations, farm income, food wastage, and ecosystem services. When combined with a literature survey, visioning serves as an effective and more reliable tool for selecting indicators. In agricultural extension research studies, it involves concerned stakeholders who are relevant to the study and can help identify relevant indicators for the study.
Composite Index
A single indicator may not capture complex concepts like food system sustainability. A composite index emerges, which combines multiple individual indicators into a single numerical measure. Composite indices are used to study concepts that are multi-dimensional in nature. Initially, relevant indicators are selected from the list of possible indicators. The chosen indicators may be measured in different units, and they need to be normalised. Two significant normalisation methods widely used in academia are Z-score normalisation and Min-Max normalisation.
Normalisation helps to bring heterogeneous indicators onto the same scale and ensures fair comparison across indicators and dimensions. Then the indicators need to be weighted using equal weights, experts’ opinions, or other statistical methods. Assigning weights to the indicators ensures that the composite index accurately reflects the relative importance of the indicators within the study’s context.
Finally, the indicators have to be aggregated, and the two most common methods of aggregation are through the arithmetic mean and the geometric mean. Aggregation brings the multiple and diverse indicators into a single composite index. It allows for comparison and supports decision-making. In addition, we had a hands-on experience in constructing a composite index using Excel.
Sustainability mapping
After assessing the sustainability scores of the food system using specific methods, such as an index-based approach, mapping these scores is crucial. Because mapping visually reveals spatial patterns, it helps simplify complex information and enhances the communication of results. For mapping, we need spatial data and attribute data. Spatial data refers to geographical information, including the latitudinal and longitudinal coordinates of the study area. In contrast, attribute information refers to the attributes of the study area, including its name and sustainability scores. Specifically, spatial data must be in vector or raster format, while attribute data must be in a table format. We can derive spatial data through remote sensing, census/survey or independent sampling, whereas for attribute data, survey and secondary data sources can be utilised. Several data repositories are available for obtaining spatial data, including the Global Administrative Area Database (GADM), the Humanitarian Data Exchange, and the websites of individual countries or ministries. The data repositories for thematic data include Google Earth Engine, USGS Earth Explorer, NASA, SEDAC, FAOSTAT, and World Bank Microdata, among others. We had a hands-on experience in creating a sustainability map for Kerala with the provided data using R software.
OUR KEY LEARNINGS
Continuous evaluation matters: Assessing sustainability is not sufficient to make progress towards SDGs. Continuous evaluation is necessary to provide a clear picture of our current state, identify areas where we fall short, determine the direction we need to take, and also to compare performance across actors, time, places, and other factors.
Use systems thinking approach: Understanding sustainability from multiple perspectives of actors in the food system is essential, rather than focusing on isolated actors/factors. Applying systems thinking in extension research can help us address complex and diverse concepts, such as sustainability.
Visioning for Indicator Selection: Beyond conducting a literature search and relying solely on expert ratings for indicator selection, visioning could be a powerful tool for selecting relevant indicators. It ensures giving attention to stakeholders’ voices.
Embrace actor mapping & visualisation tools: The Actor mapping in extension research will provide more insights, aid in selecting relevant methods and preparing instruments for data collection. Remote Sensing and Geographical Information System (GIS) mapping helps visualise results better in extension research and provides stronger, context-specific policy recommendations.
Enhance analytical & communication skills: Proficiency in tools like R and Excel is crucial for data analysis and communicating findings effectively, which enhances the overall quality of extension research.
SCOPE OF IMPROVEMENT
The learning hours were comfortable, but could be increased to facilitate in-depth learning and discussions. The duration of the hands-on session on sustainability mapping could have been increased. Phase II of the workshop needs to be considered.
Acknowledgement
We extend our gratitude to the programme coordinators, Dr. Archana R. Sathyan, Dr. Verena Suefert, Dr. Allan Thomas; the resource persons, Ms. Julie Fortin, Dr. Haseena Kadiri; the guest speakers, Dr. Sukanya Basu, Dr. Ingo Grass, Dr. Anne Elise Stratton and Dr. Andreas Schweiger, who all made this special course a wonderful learning experience by sharing their knowledge and expertise.
 Shanmuga Surya is a second-year PhD scholar in Agricultural Extension Education at the Department of Agricultural Extension Education, College of Agriculture, Vellayani, Kerala Agricultural University. His research focuses on Policy, Agency, and Resilience Assessment. He can be reached at shanmugasurya86@gmail.com / www.linkedin.com/in/shanmuga-surya-a567032b2
 Jason Arockiam is a third-year PhD scholar in Agricultural Extension Education at the Department of Agricultural Extension and Rural Sociology, Tamil Nadu Agricultural University, Coimbatore. His research interests include Sustainable Food Systems, Systems Thinking and System Dynamics. He can be reached at jasonmsd1998@gmail.com / www.linkedin.com/in/jason-extension
Add Comment